Tuesday, May 17, 2016

Unit 7: Absolute and Comparative Advantage

Absolute Advantage

Individual Absolute Advantage exists when a person can produce more of a certain good/service than someone else in the same amount of time (or can produce a good using the least amount of resources).
National Absolute Advantage exists when a country can produce more a good/service than another country can in the same time period.
Comparative Advantage
A person or a nation has a comparative advantage when it can produce one good and give up less of the other product when comparing to another person or nation.

         Examples of output problems
1.      Words per minute.
2.      Miles per gallons.
3.      Tons per acre
4.      Apples per tree
5.      Televisions produced per hour

         Examples of input problems
1.      Number of hours to do a job.
2.      Number of acres to feed a horse
3.      Number of gallons of paint to paint a house.

 Specialization and trade


 Gains from trade are based on comparative advantage, not absolute advantage. The ratio of trade is established as 1 unit of product 1 : lowest opportunity cost of product 2 to higher opportunity cost of product 2. 

Unit 7: Foreign Exchange Market

Foreign Exchange Market

 The buying and selling of currency.

Ex. In order to purchase souvenirs in France, it is first necessary for Americans to sell (supply) their dollars and buy Euros.

 Any transaction that occurs in the balance of payments necessitates foreign exchange.
 The exchange rate (e) is determined in the foreign currency markets.


 Changes in exchange rates

  Exchange rates (e) are a function of the supply and demand for currency.
  An increase in the supply of a currency will decrease the exchange rate of a currency.
  A decrease in supply of a currency will increase the exchange rate of a currency.
  An increase in demand for a currency will increase the exchange rate of a currency.
  A decrease in demand for a currency will decrease the exchange rate of a currency


Appreciation and depreciation

       Appreciation of a currency occurs when the exchange rate of that currency increases.
       Depreciation of a currency occurs when the exchange rate of that currency decreases (e decreases)

Note: the more you supply, the value depreciates. The more you demand value appreciates.
Exchange rates determinants
  • Consumer tastes (buyers taste)
  • Relative income
  • Relative price level
  • Speculation


Exports and imports
The exchange rate is a determinant of both exports and imports.

Appreciation of the dollar causes American goods to be relatively more expensive and foreign goods to be relatively cheaper, thus reducing exports and increasing imports.
Depreciation of the dollar causes American goods to be relatively cheaper and foreign goods to be relatively more expensive, thus increasing exports and reducing imports.

As two currencies trade:

1.      One supply line will change; the other demand line will change.
2.      They will move in the same direction.
3.      One currency will appreciate, the other will depreciate.


Flexible rate
Based on the supply and demand of that currency versus the other currency. It is very sensitive to the business cycle and it provides options for investment.
Fixed rates

It is based on a countries willingness to distribute currency and to control the amount.

Unit 7: Balance of Payments

Balance of payments
BOP are measures of money inflows and outflows between the United States and the rest of the world (ROW).

Inflows are referred to as credits
Outflows are referred to as debits

The balance of payment is divided into three accounts:
1.      Current account
2.      Capital/financial account
3.      Official reserves account

Double entry book keeping
Every transaction in the balance of payments is recorded twice in accordance

Current account

 Balance of trade or Net exports
Exports of goods/services- import of goods/services.
Exports create a credit to the balance of payments.
Imports create a debit to the balance of payments.
 Net foreign income
 Income earned by the U.S. owned foreign assets
 Interest payments on U.S. owned foreign assets- Interest payments on German-owned U.S treasury bonds.
 Net transfers (tend to be Unilateral).

 Foreign aid- a debit to the current account.
 Example- Mexican migrant worker sends money to family.

Capital / Financial Account
The balance of capital ownership.
Includes the purchase of both real and financial assets

  Direct investment in the United States is a credit to the capital account.


 Direct investment by United States firms/individuals in a foreign country are a debit to the capital account.
 Intel factory construction in Germany
·         Purchase of foreign financial assets represents a Debit to the capital account.
               (Warren buffets buys stock in Petrochina.)
·         Purchase of domestic financial assets by foreigners represents a credit to the capital account.
            (The UAE sovereign wealth fund purchases a large stake in the NASDAQ.)

 Relationship between current and capital account

The current account and the capital account should zero each other out.
That is….if the current account has a negative balance (deficit) then the capital account should then have a positive balance (surplus).

 Official reserves

  The foreign currency holdings of the U.S. fed.
  When there is a balance of payments surplus the fed accumulates foreign currency and debits the balance of payments.
  When there is a balance of payments deficit, the fed depletes its reserves of foreign currency and credits the balance of payments.

Active v. passive official reserves


The U.S. is passive in its use of official reserves. It does not seek to manipulate the dollar exchange rate.
The People's Republic of China is active in its use of official reserves. It actively buys and sells dollars in order to maintain a steady exchange rate w/ the United States.


Formulas

Balance of trade:     Good exports + goods imports
Balance on goods & services:        Goods exports + service exports + goods imports + service imports.
Current Account:         Balance on goods and services + net investment + net transfers
Capital account:       Foreign purchases + domestic purchases.

Unit 5: The Philips curve and Inflation

The Philips curve shows an inverse relationship between inflation and unemployment.

 The Long-Run Phillips Curve/LRPS

Measures unemployment and inflation.
NRU, or Natural rate of unemployment, is constant;
Because the Long-Run Phillips Curve exist at the natural rate of unemployment, structural changes in the economy that affect unemployment will also cause the LRPC to shift.
Increases in unemployment will shift LRPC to the right
Decreases in unemployment will shift LRPC to the left.

The Short-Run Phillips Curve

SRPC has a tradeoff between inflation and unemployment (when one increases the other decreases). (inverse relationship)

LRPC: There is no tradeoff between inflation and unemployment.
          1. The economy produces at the full employment output level.
          2.It is represented by a vertical line.
          3. It occurs at the natural rate of unemployment.

Natural unemployment rate (NRU)= Frictional +Structural +Seasonal
Full employment = 4-5%
LRAS shifters also shifts LRPC.
The major LRPC assumption is that more worker benefits create higher natural rates and fewer worker benefits create lower natural rates.
The misery index:  A combination of inflation and unemployment in any given year.
Single digit misery is good.
Inflation:
It is the general rise in the price level
Deflation:
A general decline in the price level
Disinflation:
Decrease in the rate of inflation over time
Stagflation:
Unemployment and inflation increasing at the same time.


Laffer Curve

The Laffer Curve demonstrates the relationship between tax rate and government revenue.
Tax rates only raise government revenue to some maximum, then above that maximum, they generate less revenue despite the tax rate being higher.


Unit 5: Analyzing Aggregate Supply

Short Run Aggregate Supply /SRAS
This is the period in which wages (and other input prices) remain fixed as price level increases or decreases.

Long Run Aggregate Supply /LRAS
Period of time in which wages have become fully responsive to changes in price level.
Effects over Short-Run

In the short run, price level changes allow for companies to exceed normal outputs and hire more workers because profits are increasing while wages remain constant.

In the long run, wages will adjust to the price level and previous output levels will adjust accordingly.

Equilibrium in the Extended Model
The long run AS Curve is represented with a vertical line at full employment level of real GDP.

Demand Pull Inflation

Demand pull- prices increases based on an increase in aggregate demand or AD.

In the short run, demand pull will drive up prices, and increase production.

In the long run, increases in aggregate demand will eventually return to previous levels.

Cost push & the Extended Model

Cost push inflation arises from factors that will increase per unit costs such as increases in the price of a key resource.

Dilemma for the Government
In an effort to fight cost-push, the government can react.

  • Action such as spending by the government could begin an inflationary spiral.
  • No action however could lead to a recession by keeping production and employment levels declining.


Friday, April 8, 2016

Unit 4: Money 3/10/9

The Federal Reserve is the personal bank of the government and is the central bank of the Unite States. It controls money supply, the reserve requirement, and member and distric banks.
 The Federal Reserve is the entity that controls monetary policy. They have 4 tools to work with

  1. Open Market Operations (buying and selling of bonds)
  2. Discount Rate (the interest rate that the Fed charges banks)
  3. Reserve Requirement
  4. Federal Fund Rate (the rate banks charge other banks for short term loans.
The Fed can employ two policies when using these tools, expansionary to fight a recession, or contractionary to fight inflation.

Under Expansionary Policies, The Fed wants to increase Money Supply, which will increase Ad and decrease interest rate,
To do so, they could 
  • Buy bonds
  • Lower Reserve, Discount, and Federal Funds Rate
Under Contractionary policy, The Fed want to decrease Money Supply, which will decrease AD and increase interest rates
To do so, they could
  • Sell bonds
  • Increase Reserve, Discount, and Federal Funds Rate.

Fiscal Policy Vs. Monetary Policy
The government is responsible for Fiscal Policy and the Fed is responsible for Monetary Policy

Expansionary Monetary Policy increases money supply which increase AD and lowers interest rate

Contractionary does the opposite

Expansionary FISCAL Policy increases AD through increasing Government Spending and lowering taxes, this creates a deficit and increases the interest rate. This also lower exports and import because this causes the dollar to appreciate 

Contractionary does the opposite
Image result for federal reserve monetary policy  vs fiscal policy

Unit 4: Money 3/9/16

The future value of money through interest can be determined through two formulas depending on the way the interest is calculated.

v = future value of money     r = real interest rate    n  = inflation rate     p = present value or principal
n = # of years        k  =   interest credited per year (# of times interest is given per year, etc.)

The yearly interest rate formula  that is not compounded is       v = ((1 + r) ^ n ) * 9

The compounded interest rate formula is                                    v = ((1 + r/k) ^n * k) * 9


Demand for money and its effects on AD

The demand for money has an inverse relationship with nominal interest rates and the quantity of money demanded

As the quantity of money demanded goes down, interest rates go up.
As the quantity of money demanded goes up, interest rates go down

The demand of money shifts with changes in taxes, income and price level, or anything that changes investment prospects.

The supply of money affects AD

As money supply goes up, Interest rates goes down, which increases Investment and increases AD
As money supply goes down, Interest rates goes up, which decreases Investment and decreases AD

Financial Sector

Assets are what people and institutions own, and liabilities are what they owe. If a person took a loan out, the loan would be an assets to the bank and a liability to the person.

Banks are financial intermediaries that use liquid assets and sell services to run as a business.

Most  banks today use a fractional reserve system, where banks are required to hold a fraction of their reserves. the rest the banks are able to loan out to people.

Banks and the Creation of Money

Banks create money by lending deposits that people place in banks. Potential loans are measured by T-charts or a balance sheet.
On the banks liabilities side of the T chart are Demand Deposits and Owner's Equity.
On the banks assets side of the T chart are Required reserves and Excess Reserves, Property, Securities and bonds, and Loans.

Reserve Requirement
The Fed requires banks to always have some money readily available to meet consumers’ demand for cash.
The amount , set by the Fed, is the Required Reserve Ratio or RRR.
The Required Reserve Ratio is the % of demand deposits that cannot be loaned out

To find out the amount of money that is created by loans in the entire banking system use the formula:
Amount of Money Created = ER * 1/RRR
ER * 1/RRR is also known as the money multiplier.

The money is created by this multiplier through Multiple Deposit Expansion where one person takes their loan and places it in another bank and that bank loans his deposit out, and so on and so on

Usually, the money created is less than what is calculated because sometimes banks can hold excess reserves instead of loaning it out or people might not deposit their loan


Unit 4: Money 3/7/16

Money has three uses:

  • A medium of exchange used for trade and barter
  • A unit of account or the economic worth in the exchange process
  • a store of value that people can hold to keep value over time
There are also three types of money 
  1. Commodity money: the value of the money is determined by the material of the currency: gold and silver coins. This type of money is limited.
  2. Representative money: this type of money represents a tangible good that has value, like dollars that can be exchanged for gold. This type is limited and usually more portable
  3. Fiat money: This type of money holds value solely because the government "says so" . This type of money is unlimited and portable.
Money also has six characteristics
  1. Easy to carry
  2.  durable
  3. Scarce
  4. Divisible
  5. Acceptable 
  6. Uniform
The Money Supply is split into the levels of liquidity or how easy it is to turn into cash; M1, M2, and M3. M1 is the most liquid and includes all currency in circulation, traveler's check, and checkable and demand deposits. M2 is less liquid than M1 and includes M1 + Savings accounts. M3 is the least liquid and includes M2 + certificates of deposits. 

Sunday, March 27, 2016

Unit 4 - Monetary Policy Video Summaries

Video 1:
There are three types of money; Commodity money, Representative money, and Fiat money. Commodity money would be using the values of goods, such as food or animals. This type is not very portable or divisible. Representative money is currency that can be exchanged for something of value such as gold. This money is finite however since most things of value are finite. Fiat is money that is only backed up by word of the government and is not really backed by anything valuable, but is infinite. Money has 3 functions: medium of exchange(use it to buy stuff), store of value,(save it), and a unit of account(use it to judge others).

Video 2:
Money Market graphs has interest rate(price of money) on the y axis and quantity of money on the x axis. The Demand of money line slopes downward due to the Law of Demand, as price increases, demand decreases. Supply of money is vertical because it is fixed and set by the Fed. Fed adjusts money supply to stabilize interest rates to promote economic growth

Video 3:
The Fed has three tools of Monetary Policies; Reserve rate(amount of money banks are required to keep), Discount rate(amount of interest charges to banks for loaning from other banks), and Open Market Operations(The selling and buying of securities) There are two ways to use these tools; in an Expansionary(easy money) or Contractionary(tight money) way. In order to follow the expansionary route, the fed could lower Reserve and Discount rates to free more money and buy securities to inject money into circulation. Vice Versa, the fed, if it wanted to follow a more contractionary policy, it would raise Reserve and Discount rates and sell securities to take money out of circulation.

Video 4:
The Loan-able Funds graphs has interest rate(price of money) on the y axis and quantity of loan-able funds (money) on the x axis like on the money market graph. Demand of loan-able funds slopes down still to the Law of Demand and Supply slopes upward. Supply is dependent on savings and is positive since banks turn savings into loans. Loan-able funds and the money market are closely related by interest rate. A change in interest rate in one graph will affect the other.

Video 5:
Money is created by making loans through the money multiplier and multiple deposit expansion. The money multiplier is 1/RR or reserve ratio. Multiple deposit expansion is what happens when loans get deposited then turned into loans again. This is assuming that there are NO excess reserves. the amount generated is the amount of loans times the money multiplier

Video 6:
Money Market and loan-able funds are also connected to AS and AD. Since MV = PQ, (Money Supply * Velocity of money being spent = Price * Quantity) when interest rates go up, so do prices. If Demand of loanable fund and money supply increases, it increases aggregate demand since both interest rate and price level have to increase. Interest rates are proportional to Price levels. This is called the Fisher Effect.


http://www.youtube.com/watch?v=YLsrkvHo_HA&feature=results_video&playnext=1&list=PL2CB281D126F65E26

http://www.youtube.com/watch?v=gzFdeM6lUno&feature=bf_prev&list=PL2CB281D126F65E26&lf=results_video

http://www.youtube.com/watch?v=XJFrPI8lLzQ&feature=bf_next&list=PL2CB281D126F65E26&lf=results_video

http://www.youtube.com/watch?v=rdM44CC0ELY&feature=bf_next&list=PL2CB281D126F65E26&lf=results_video

http://www.youtube.com/watch?v=1tUC59pz95I&feature=bf_next&list=PL2CB281D126F65E26&lf=results_video

http://www.youtube.com/watch?v=k37Y6BKcpsY&feature=bf_next&list=PL2CB281D126F65E26&lf=results_video


If the links don't work, try typing the URLs manually.

Enjoy! :D


Friday, March 4, 2016

UNIT 3: Aggregate Demand & Supply 2/25/16

Disposable Income is income that is left over after Taxes and Bills, Net income
Gross Income - Taxes = DI

There are only two options when deciding how to use DI: Consuming it or spending it.
if DI increases, both savings and consumptions increase
If DI = 0 then auto consumption has left no income for savings, or it has even dipped into dis-savings

Average Propensity to Consume is the average willingness to spend money
Average Propensity to Save is the average willingness to save money

Average Propensity to Consume + Average Propensity to Save ALWAYS = 1 since DI = 1
if APC > 1, or you have a negative APS = dis-savings
1 - APC = APS
1 - APS = APC

Marginal Propensity to Consume is the fractions of change that occurs to consumption when DI changes.

Marginal Propensity to Save is the fractions of change that occurs to Savings when DI changes.

Change in Consumption        =    MPC
Change in DI

Change in Savings        =    MPS
Change in DI

Like APC and APS, MPS + MPC = 1

Spending Mulitpliers

The formula to find Government Spending Multiplier is 1/MPS or 1/(1-MPC)

The formula to find Tax Multiplier is negative MPC/MPS

The Paradox of Thrift claims that people save in a recession, which worsens the condition of the recession.

If consumption is 1:1 with DI, there is a upwards sloping 45 degree function where C = DI and there is no Savings

2/29/16

Deficit budget means that we spend more than we take in   Revenue<Expenditures
Surplus Budget means that we earn more than we spend     Revenue>Expenditures
Balanced Budget means that we break even                         Revenue=Expenditures

If a government is in a deficit, it primarily borrows money to pay it back
It can borrow money from citizens and corporations in the form of taxes and bonds, or it can borrow money from foreign governments.

Fiscal Policies include 2 things; Discretionary(action must be taken) and Non Discretionary(no action needed) policies

The government has two options to discretionary actions it can control to help regulate the economy: Change Taxes or Change Government Spending

Easy money is used to combat recessions and involves lessening taxes and increasing government spending

Tight money is used to combat inflation and involves raising taxes and increasing government spending

Non discretionary policies would include Automatic Stabilizers; Such as Social Security, Welfare, government transfer payments, Medicare and Medicaid


UNIT 3: Aggregate Demand & Supply 2/23/16

Investment Demand is the demand for new factories, machinery , technology, new homes, inventory.

Expected Rate of Return determines how much people invest; The higher the expected rate of return the more people will be willing to invest in businesses.
Interest Rates > Expected Rate of Return =  No or less interest
Interest Rates < Expected Rate of Return =  More interest

Real(r% or interest cost) vs Nominal Interest(i%)
r% = i% - pi(inflation rate)

Interest Demand Curve is sloping downward;
As interest rate goes up, Loans supplied decreases
And as Interest rates goes down, Loans supplied increase.

Lower costs and Lower Business Taxes push the curve to the right
Positive changes in technology also pushes ID curve to the right
More Stock Capital in the economy increases the curve to the right
Expectations Positive moves it right and Negative moves it left.

2/24/16

Classical Vs Keynesian Economic Schools of Thought  

Classical includes thoughts such as:

  • Competition is good
  • "invisible hand" or self regulation of the economy
  • the economy is at balance at Full Employment 
  • "Trickle down" effect
  • Strengthening the rich so they can strengthen the poor 
  • Modern followers include: Adam Smith, J.B. Say, Alfred Marshall, David Ricardo
  • Say's Law: Supply creates Demand 
  • Under-spending is Unlikely
  • Production = income = spending
  • investment = savings
  • Prices and Wages are flexible downward 
  • Unemployment is negated by price/wage flexibility but can be cause by external sources
  • Inflation is caused by too much money
  • Basic Equation is MV = PQ
Keynesian includes thoughts such as:

  • Competition is flawed
  • Aggregate Demand creates Supply not vice versa
  • Leaks in the circulation or savings cause recessions
  • Ratchet effect causes sticky wages
  • Recession's block Say's Law
  • In the long run "We are all dead"
  • Modern Followers include: J.M. Keynes
  • Depressions refute Say's Law
  • Under-spending persists.
  • Saving does not equal Interest since people save/invest for different reasons
  • Lending boost money supply
  • Prices and wages are inflexible downward due to the Ratchet effect
  • Basic Equation is  C + Ig + Xn + G
  • Inflation is caused by too much demand
  • Government should use fiscal policy to regulate economy 
  • Economy is not self regulating, no "invisible hand" 

UNIT 3: Aggregate Supply 2/19/16

Aggregate Supply is the Level of GDP that an economy will produce at the price level.
There are 2 types of Aggregate Supply, Long Run AS and Short Run AS.
In the Long Run:

  • Input prices are flexible and adjusted to price changes 
  • Real GDP is independent of price level
  • Represents a level of "Full Employment"
  • Analogous to PPC 
  • Vertical due to flexible prices
In the Short Run:
  • Input prices are sticky and do not adjust to price level
  • Real GDP is directly related to Price Level.
SRAS is pretty much how much it costs to produce one unit of product.
Total output               =      Level of productivity 
Total input 

Total output               =      Cost of Production per unit
Total input PRICE
 
2/22/16

Input prices include wages(75%), Cost of Capital (factories and tools), Raw Material and foriegn resource prices.

SRAS shifts depending on 3 factors that affect production; Productivity, Legal Institution Environments (Taxes/subsidiaries), Government Regulations.

"Full Employment" (unemployment at around 4-5%) lies where SRAS LRAS and AD intersect

Recessionary Gap: Equilibrium below FE Level
Inflationary Gap: Equilibrium occurs beyond FE Level

3 ranges of SRAS: Keynesian Range, Classical Range, and an Intermediate Range (goes more in depth later) 

Nominal Wages - Total amount of money received before deductions (Taxes, Bill, etc)
Real Wages - Net wages or amount of buying power the wages have after deductions 
Sticky Wages - Nominal wages set to a specific price level due to things like work contracts etc.

UNIT 3: Aggregate Demand 2/18/16

Aggregate Demand is the summation of all the demand in one economy, prices move along the curve.
AD is affected by Consumption, Gross Investment, Government spending, and Net Exports


The demand slope always points downward for 3 reasons or effect: The Real Balance Effect (High prices means low purchasing power which leads to less quantity vice versa.), The Interest Rate Effect (An increase in price raises the interest rate, which lowers consumer spending), and the Foreign Trade Effect (If USA prices increase, it decreases foreign purchases, which decreases Xn or Net Exports)

AD is affected by two things, a change in GDP(C, Ig, G, Xn) or multiplier effect.
If AD decreases, it shifts left and if it increases, it shifts to the right.

Consumption: Determined by-
Consumer Wealth - Right if more; Left if less
Consumer Expectations - Positive goes right; Negative goes left
Household Indebtedness - Right if less; Left if more
Taxes - Right if less; Left if more

Gross Private Investment: Determined by:
Real Interest Rate - Right if lower; Left if higher
Expected Returns - Right if higher; Left if lower
Influenced by:
Profit Expectations
Technology
Degree of excess capacity
Business taxes

Government SpendingDetermined by:
More; AD shifts right
Less; AD shifts left

Net Exports: Determined by:
Relative Income
Strong foreign economy leads to More exports; AD shifts Right
Weak foreign economy leads to Less exports; AD shifts Left
Exchange rates
Strong Dollar leads to More imports; Fewer exports AD shifts Left

Weak Dollar leads to  Less imports; More exports AD shifts Right


Wednesday, February 10, 2016

UNIT 2: Unemployment 2/4/16

Unemployment - Failure to use available resources, labor, to produce desired goods and services

The Labor Force includes those above 16 and able and willing to work. (Employed + Unemployed)

The Labor Force does not include:

  • Military
  • Students
  • Retired 
  • Disabled
  • Stay at home people/ Home makers
  • People in Mental Institutions
  • People in Jail or Prison
  • Those not looking for a job

Unemployment rate: 4-5% is considered "ideal" or as Full Employment, or the Natural Rate of Unemployment.

To Calculate Unemployment rate:

Unemployed
Labor Force       * 100

The 4 Types of Unemployment


Frictional + Structural = NRU

Full Employment = no cyclical unemployment, Cyclical unemployment is bad!

A GDP Gap is the amount that the actual GDP falls short of potential GDP.

Okun's Law states that for every 1% the actual unemployment rate exceeds the NRU the GDP gap is about 2%.

Rule of 70 is used to detemine how many years it takes for a value to double on a set rate.

70
Interest   =  # of years

Ex. If you put $20,000 in a bank, an it earns a yearly interest of 7%, how many years will it take for that amount to double?

70
7%        =    10 years

UNIT 2: GDP 2/2/16

Nominal Interest Rate: % increase in money paid for interest, Not adjusted for Inflation, but for anticipated inflation.

NI = Expected Inflation Rate + Inflation Premium (usually less than 10) 

Real Interest Rate= % increase in purchasing power in interest, adjusted for inflation, Unanticipated 

Inflation.


The Fisher Effect states that the real interest rate is equal to the nominal rate minus the expected rate of inflation.


RIR = NIR - Expected Inflation rate


COLA or Cost of Living Adjustment: Automatically raises wages to increase with inflation.

UNIT 2: GDP 2/1/16

Nominal GDP - Value of output provided in current prices, can increase year to year if output or prices increase. Not adjusted for inflation

Real GDP - value of output produced in constant prices or base year prices. Adjusted for inflation can increase from year to year only if out put increases.

To find Nominal GDP you multiply Price by Quantity in the same year
To find Real GDP you multiply Price from base year by Quantity of the new year

Increase in Economy = Real GDP

Increase in inflation = Nominal GDP

GDP deflator - price index to go from Nominal to Real GDP

The equation to get the GDP deflator is Nominal divided by Real GDP then multiplied by 100

Consumer Price Index - most commonly used to measure for inflation and measures cost of goods of a typical family

The equation is:

Cost of market bag of goods in year 2        *  100
Cost of market bag of goods in base year

The equation for Inflation is:

Price Index in year 2 - Price Index in year 1    * 100  
Price Index in year 1

Certain groups are hurt and helped by inflation. Those hurt are usually people who save, loan out, or people on a fixed income. Those helped are usually those who borrow, or debtors.

UNIT 2: GDP 1/29/16

There are two ways to calculate GDP: Expenditure and Income approach.
Expenditure is more reliable as the values cannot be easily falsified unlike the Income approach
To calculate GDP the expenditure way, you add:

  1. Consumer Expenditures 
  2. Gross Private Domestic Investments
  3. Government Purchases
  4. Net Exports (Exports - Imports)
To Calculate GDP the income way you add together:

  1. WRIP (Wages, Rent, Interest, Proprietor's income)
  2. Stat adjustments (Indirect business taxes, Depreciation(Consumption of Fixed Capital), and Net Foreign Factor Payments )
There are two ways to calculate National Income, you can add together;

  1. Employees compensation (wages, SS, pension plans)
  2. Rent (income for property owners)
  3. Interest Income (loaners' income)
  4. Corporate Profits 
  5. Proprietors Income (income for partnerships) 
The second way would be to subtract stat adjustments from GDP.

In order to find Disposable National Income, you take National Income and subtract Personal Taxes and add Government Transfer Payments

Net Domestic Product = GDP - depreciation

Net National Product = GNP - depreciation

GNP = GDP - Net Foreign Factor Payment

You calculate if you have a budget deficit or surplus by adding Government Purchases and Government transfer payments and subtracting Government taxes and fee collection.
If you end up with a positive number, you have a budget deficit and if you have a negative number you have a budget surplus.

To calculate a trade surplus or deficit, you subtract exports by imports. If you end up with a negative number, you have a trade deficit and if you end up with a positive number, you have a trade surplus.

UNIT 2: GDP 1/26/16

GDP - the market value of all final goods and services, produced within a nation in a given year.

Not included in GDP: 
  • Used or 2nd hand goods
  • Purely financial transactions (stocks and bonds)
  • Unreported business activity
  • Illegal activity
  • Non-market activity (volunteering)
  • Transfer payments (public: SS welfare, private: scholarships)
  • Intermediate goods (raw materials used to make final product) 
1/28/16
GDP is generally composed of 65% personal consumer expenditures, 17% gross private domestic investments(which includes new factory equipment/maintenance ), 20% government purchases, and -2 % net exports (Exports - Imports)

Also circular flow:

Resources sell resources(factors of production)  and buy products in the Factor market.
Firms sell products and buy resources in the Product market.'

Monday, January 25, 2016

UNIT 1 Notes

1/5/16
Macro Economics: Economics as a whole includes inflation wage laws and international trade i. e. the whole forest
Micro Economics: Economics as sectors includes supply and demand, market structures and business organizations i. e. one tree

Positive Economics: Statements based on fact and can be proven "Is"
Normative Economics : Statements based on opinion "Should"

Scarcity vs Shortage
Scarce is rare, most fundamental problem to satisfy unlimited demand with limited supply; Shortage is when a product's demand > supply

4 Factors of production:
 Land, Labor, Entrepreneurship, and Capital; Human Capital(knowledge) or Physical Capital(tools)

1/6/16
Trade-offs: alternatives that we give up in exchange for something else
Opportunity cost: next best alternative
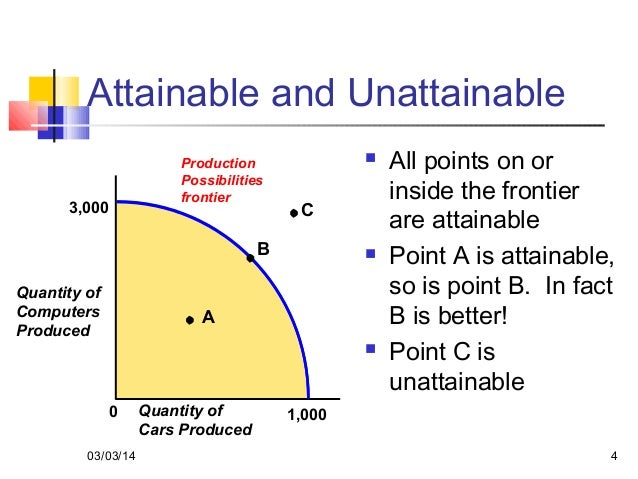
Production Possibilities Graph, PP Curve/PP Frontier:graphs alternative ways to graph use of economics resources has 4 assumptions assigned with it;
  1. Two goods are being produced 
  2. Fixed resources 
  3. Fixed tech 
  4. Full employ of resources


If a point is on the inside it is attainable and inefficient
If a point is on the PPC/PPF it is attainable, but hard, and efficient
If a point is outside the PPC it is unattainable with this current level of technology and resources


Efficiency: maximizing use of resources
Allocative resources: Satisfying the public with resources
Productive Efficiency: Products are being produced most efficiently and represents a point on the PPC/PPF
Under-utilization: Not using all resources

3 types of movements along the PPG:
1. point moves to the inside
2. point moves along PPC
3. The PPC shifts

1/7/16

6 Causes for PPC to shift:


  1. Technology increases 
  2. Δ in resources 
  3. Δ in labor
  4. Economy expands
  5. Natural Disasters (war/famine)
  6. Education increases


1/13/16

Price Elasticity of Demand: Measure on how consumers react to change in prices
Elastic demand: E > 1, sensitive to Δ, not a necessity/can be substituted
Inelastic demand: E< 1, not sensitive to Δ, necessity
Unitary Elastic: E = 1

How to calculate PED:
New quantity - old Quantity = Δ% in Quantity demanded
           old Quantity


New Price - Old Price
= Δ% in Price
            Old Price

Δ% in Quantity demanded = Price elasticity of demand
            Δ% in Price

1/14/16

Fixed costs/FC: costs that do not change

Variable costs/VC: costs dependent on quantity

Marginal cost/MC: Δ in Price to produce one more unit

MC = New TC - Old TC

Total FC + Total VC = TC                           AFC + AVC = ATC

TFC / Q = AFC                                         TVC/Q = AVC

TC/Q = ATC                                            TFC = AFC * Q

TVC = AVC * Q                                       TC = ATC * Q


1/15/16
Fire drill

1/18/16

Demand: The # of products people willing or able to buy at various prices
Demand curve always goes down
Law if Demand: Inverse relation of Price to Demand: As price increases, demand goes down. As price decreases, demand goes up
Δ in quantity demand is only affected by Δ in price
Δ in demand has 5 determinants:

  1. Δ in Buyer's taste
  2. Δ in # of buyers
  3. Δ in income (relates to normal goods and inferior goods)
  4. Δ in price of related goods: substitute goods or complimentary goods
  5. Δ in Expectations 


Normal goods: as income increases, demand increases
Inferior goods: as income increases, demand decreases

1/19/16

Supply: Quantities that producers or sellers are willing or able to produce at various prices
"Supply to the sky"
Law of Supply: Directly proportional relation between price and quantity; as price increases so does quantity, as price decreases so does quantity.
Δ in Quantity supplied is only affected by Δ in price
Δ in supply has 6 determinants:

  1. Δ in tech 
  2. Δ in weather
  3. Δ in cost of production 
  4. Δ in # of sellers/producers
  5. Δ in taxes/subsides
  6. Δ in Expectations


1/20/16

Peak - Highest point of real GDP, greatest spending, least unemployment, inflation

Expansion - Recovery, real GDP growing, unemployment decreasing

Recession - Real GDP decreasing, unemployment increasing

Trough - Lowest point of real GDP, highest unemployment