Macro Economics: Economics as a whole includes inflation wage laws and international trade i. e. the whole forest
Micro Economics: Economics as sectors includes supply and demand, market structures and business organizations i. e. one tree
Positive Economics: Statements based on fact and can be proven "Is"
Normative Economics : Statements based on opinion "Should"
Scarcity vs Shortage
Scarce is rare, most fundamental problem to satisfy unlimited demand with limited supply; Shortage is when a product's demand > supply
4 Factors of production:
Land, Labor, Entrepreneurship, and Capital; Human Capital(knowledge) or Physical Capital(tools)
1/6/16
Trade-offs: alternatives that we give up in exchange for something else
Opportunity cost: next best alternative
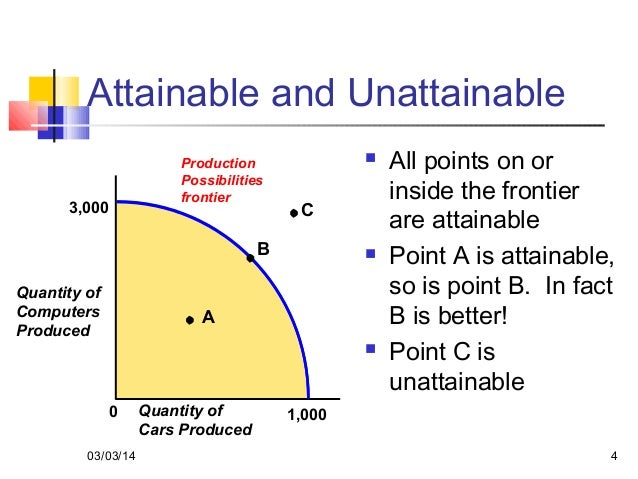
Production Possibilities Graph, PP Curve/PP Frontier:graphs alternative ways to graph use of economics resources has 4 assumptions assigned with it;
- Two goods are being produced
- Fixed resources
- Fixed tech
- Full employ of resources

If a point is on the inside it is attainable and inefficient
If a point is on the PPC/PPF it is attainable, but hard, and efficient
If a point is outside the PPC it is unattainable with this current level of technology and resources
Efficiency: maximizing use of resources
Allocative resources: Satisfying the public with resources
Productive Efficiency: Products are being produced most efficiently and represents a point on the PPC/PPF
Under-utilization: Not using all resources
3 types of movements along the PPG:
1. point moves to the inside
2. point moves along PPC
3. The PPC shifts
1/7/16
6 Causes for PPC to shift:
- Technology increases
- Δ in resources
- Δ in labor
- Economy expands
- Natural Disasters (war/famine)
- Education increases
1/13/16
Price Elasticity of Demand: Measure on how consumers react to change in prices
Elastic demand: E > 1, sensitive to Δ, not a necessity/can be substituted
Inelastic demand: E< 1, not sensitive to Δ, necessity
Unitary Elastic: E = 1
How to calculate PED:
New quantity - old Quantity = Δ% in Quantity demanded
old Quantity
New Price - Old Price = Δ% in Price
Old Price
Δ% in Quantity demanded = Price elasticity of demand
Δ% in Price
1/14/16
Fixed costs/FC: costs that do not change
Variable costs/VC: costs dependent on quantity
Marginal cost/MC: Δ in Price to produce one more unit
MC = New TC - Old TC
Total FC + Total VC = TC AFC + AVC = ATC
TFC / Q = AFC TVC/Q = AVC
TC/Q = ATC TFC = AFC * Q
TVC = AVC * Q TC = ATC * Q
1/15/16
Fire drill
1/18/16
Demand: The # of products people willing or able to buy at various prices
Demand curve always goes down
Law if Demand: Inverse relation of Price to Demand: As price increases, demand goes down. As price decreases, demand goes up
Δ in quantity demand is only affected by Δ in price
Δ in demand has 5 determinants:
- Δ in Buyer's taste
- Δ in # of buyers
- Δ in income (relates to normal goods and inferior goods)
- Δ in price of related goods: substitute goods or complimentary goods
- Δ in Expectations
Normal goods: as income increases, demand increases
Inferior goods: as income increases, demand decreases
1/19/16
Supply: Quantities that producers or sellers are willing or able to produce at various prices
"Supply to the sky"
Law of Supply: Directly proportional relation between price and quantity; as price increases so does quantity, as price decreases so does quantity.
Δ in Quantity supplied is only affected by Δ in price
Δ in supply has 6 determinants:
- Δ in tech
- Δ in weather
- Δ in cost of production
- Δ in # of sellers/producers
- Δ in taxes/subsides
- Δ in Expectations

1/20/16
Peak - Highest point of real GDP, greatest spending, least unemployment, inflation
Expansion - Recovery, real GDP growing, unemployment decreasing
Recession - Real GDP decreasing, unemployment increasing
Trough - Lowest point of real GDP, highest unemployment